Excelerator - Save Report Definition
What is it?
- Save Excelerator reports that you run frequently (monthly, quarterly, etc.) for easier access.
Who can save Excelerator reports?
- Form Owners can save Excelerator reports for the forms they own.
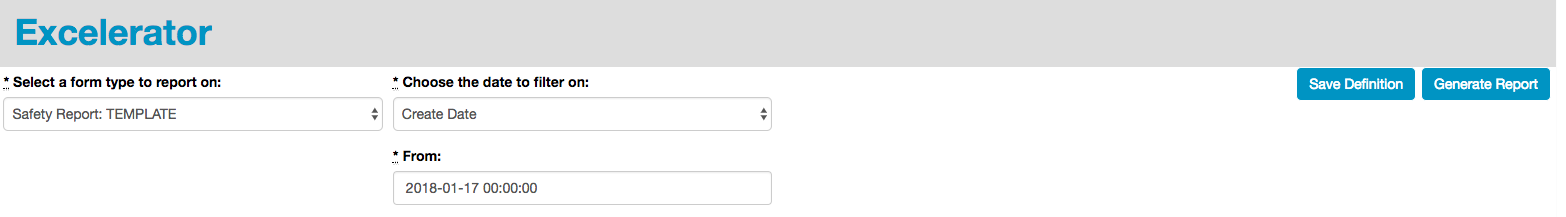
How do you save Excelerator definitions?
- Select “Save Definition” to save the fields you have selected. Be sure to save the definition before generating the report.
- Any Saved Definitions will appear on the Excelerator dashboard.
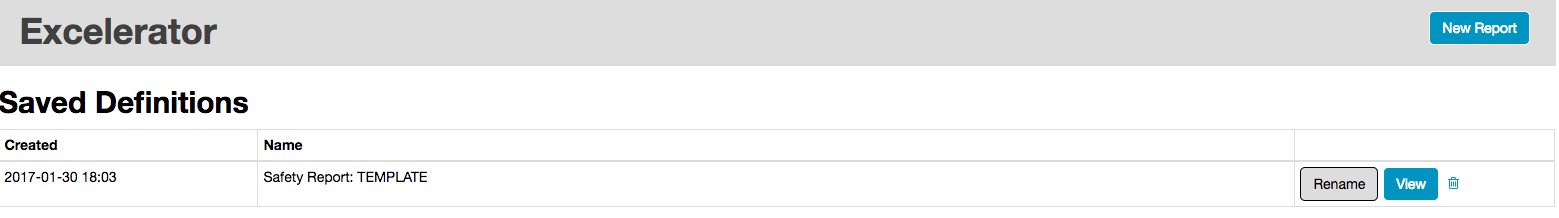
- Rename your Saved Definition for easy identification.
- To re-run the report, click View.
- Update the date fields, if needed.
- Select Update Definition to save any changes.
- Select Generate Report to run the new report.
- To delete a definition, click the trashcan icon next to the View button.
Related Articles
Excelerator - Create Report
What is it? With Excelerator, you can export any of your form submission data to a .csv file. Who can create Excelerator reports? Any Form Owner can create Excelerator reports for the forms they own. Where can Excelerator reports be created? From ...
Submitting a Safety Report (SR)
What is a Safety Report in Baldwin? Safety Reports identify hazards within your operation and are a tool to support the SMS component Safety Risk Management. Safety Reports should be submitted for incidents, events and occurrences, to report a ...
Report Card
What is it? The Report Card displays a snapshot of the overall activity and performance of your organization. The default date range is set to the last 12 months, but you are able to configure the date ranges by the following options: yearly (up to ...
User Activity Report
What is it? The User Activity Report displays the number of active days per user per month. (Please note: This report does not show the number of logins per user.) Active Day = day a user interacts with the Baldwin site Report updates the first of ...
Create Pie and Line Charts
What is it? Charts allows you to construct pie charts for conditions in the data, as well as time series. You can also create overview charts of mapped events, if your portal has been configured to utilize the Maps feature. What this means is that ...